
1. Presentation
The functioning of a cycling infrastructure network requires not only a good conception plan and its implementation, but also its management, monitoring and maintenance, in order to address the reviewing, updating and evolving needs of the city’s cycling plan. It is important to create an operational structure to manage cycling facilities and services. It should be responsible for monitoring and inspecting the mobility plan and for the actions associated with the implemented measures.
The management and monitoring service should contemplate cycling infrastructural networks (i.e. cycle paths, intersection areas, kerbs, bicycle parking), facilities shared with other transport means (i.e. pedestrian streets, shared streets, sidewalks, roads, urban furniture, traffic signs) and the adequacy of provided services. Monitoring the impact of past interventions will strengthen future investments and it should integrate a long run vision and strategy of the city’s mobility.
Maintenance services exist to assure the long run efficiency of the cycle networks, verifying if they are adequate to the populations needs. A cycle path network plan that assures from its beginning a maintenance problem with a team responsible for that service, will have least costs in the future.
2. Objectives
- Managing the revision, upgrade and expansion needs of the cycling plan.
- Developing a long run vision and strategy of cycling mobility.
- Evaluating and monitoring the cycling infrastructural network, adjusting it to the users’ needs.
- Managing available resources.
- Maintaining cycling infrastructures and its associated services (cycle path networks, lighting, traffic signs, parking, support and information service).
- Assuring the cycling facilities and infrastructure remain in good safety and use conditions.
3. Measure’s importance
Given the level of investment in the construction of cycling networks and facilities, it is important that these are well planned and remain attractive to users, assuring a safe and harmonious use by a rising number of users and activities. This measure is essential to assure the functioning and efficacy of the network, as well as resolving problems and responding to the populations’ needs. Hence, this measure should be contemplated in every package of measures.
1. Good Practices
– A network maintained in good conditions will have greater use levels than a deteriorated one.
– Managing, monitoring and maintenance should be contemplated since the beginning of the development of the cycling plan, as a way to assure the adequate provision of material and human resources.
– Special attention should be given to systematic data collection for the efficiency of the cycling network management.
– It is essential to involve and understand the needs of users when developing the cycling plan and have open channels for them to communicate their maintenance and improvement needs.
– Inspection and maintenance of the cycling networks and facilities should be handled on a regular and scheduled basis and include contingency plans in case of inclement weather or other occurrences.
2. Actions
 | Management Office Multidisciplinary team, with traffic management, communication, coordination and training attributes. It should have a leader capable of managing everyone involved. The skills of the team include: • Establish a cycling network and services monitoring programme, evaluating its adequacy; • Retrieving data, evaluate the impact of the implemented measures, develop studies; • Promote information, communication, promotion and exposure actions associated with the implemented measures; • Promote the involvement of the different stakeholders in cycling mobility; • Conduct periodical inspections and audits; • Disclose periodical reports; • Plan revisions and upgrades of the city’s cycling plan, in the scope of a long run strategic vision; • Manage resources. |
 | Inspection and audit Inspecting and evaluating cycling facilities can be focused on the cycling network, on the connections or routes, and on the facilities (path sections, crossings, bicycle parking). It can involve an infinity of aspects, including street surface inspection, cleaning, intersections, safety, etc. (Crow, 2016). It is fundamental to properly suit the cycling plan to the present needs and future evolution. |
 | Bike Counters/Barometers Electronic devices placed in strategic points of the cycling network exhibiting the number of cyclists that pass through that point throughout the day/month/year. They supply data regarding the number of users for monitoring services and the interventions’ impacts. Simultaneously, they serve has a sensitizing promotional tool by showing that cyclists are accounted for. The choice for its location is a key factor, since it should be in a clearly visible place where plenty of cyclists go through regularly. In that sense, they should only be installed when there are numbers deserving to be publicly showed. Alternatively, there are counters without an exhibition mechanism, allowing for an initial data collection without disclosing the numbers publicly. Note: Counters may not supply a completely accurate account of cyclists (due to factors has the counting of pedestrians or missing one cyclists if he is blocked by another); yet they show the trend. Learn more: https://peopleforbikes.org/blog/the-magic-of-bike-barometers/ |
 | Data collection and development of studies For monitoring purposes, periodical studies and inquiries on mobility should be conducted with the purpose of identifying mobility patterns and their evolution, verifying their adequacy and better informing public policies. This will allow the construction of more consistent reports and the implementation of measures with better cost-benefit. Additionally, Investigation and Development activities can be promoted (focusing on creating value/making the bicycle accessible). Ex.: Portugal Bike Value – project aiming to present the potential of the Portuguese national territory to locate the bicycle industry, by integrating technological centres, universities and local authorities. |
 | Maintenance service support office Team with the responsibility to: Establish a maintenance programme; Assuring the pavement, traffic sings and facilities is always in good conditions; Conducting periodical inspections; Use local volunteers to support attaining information and maintaining secondary networks; Elaborating periodical reports; Assuring a way to contact users to inform them of maintenance needs; When there are maintenance works, assure alternative routes and properly inform the users. Note: If the maintenance doesn’t work it can hinder cycling and lower network safety. |
 | Cycling network maintenance service Maintaining routes: draining channels and gullies; sweep detritus; fix covers and holes; repair worn markings or colourful pavements; assure proper lighting according to solar exposure; include greater maintenance in winter. Maintaining bicycle parking (See Bicycle parking network). Maintaining traffic signs: assure periodical inspection and maintenance of traffic signs. |
 | Bicycle repair workshops Recycling and maintaining shared bicycles. Service stations for cyclists for small adjustments and repairs (i.e. tire inflating). Workshops are essential to pull new users. They can also serve and educational function like repairing a tire or finding material for repairs. They can also serve to share ideas and exchange bicycle parts. E.g.: Espaço Bicicleta da Universidade de Aveiro. (See Cyclists’ support infrastructure) |
 | Maintaining information platforms Online platforms with updated information. |
Tactical urbanism
Several cities around the world experiment Tactical Urbanism, i.e. low-cost and fast-acting interventions as a way to manage public space and test and catalyse long term projects that improve road safety and help to create quality public spaces.
Learn more: https://issuu.com/streetplanscollaborative/docs/tactical_urbanism_vol.1
1. Impacts
 | Mobility system efficiency It is essential to the efficiency of the cycling network. A good cycling network is competitive with the automobile and contributes to the efficiency of the entire mobility system. |
 | Livable streets It makes the streets safer and friendlier for all users, assuring public space quality and more livable streets. |
 | Protection of the environment It assures the long term quality, safety and sustainability of the cycling network, promoting the increase in cyclists, the dwindling number of motorized vehicles and the consequent positive environmental impacts. Workshops will assure the recycling of the bicycles and their equipment, thus contributing to a good equipment management. |
 | Inclusion, equity and accessibility It contributes to make bicycle safer and accessible to all. The community should have communication channels with the responsible team. Some countries use one resident in each urban area as a representative of a cycling area, which constitutes a support element and could also be a n instrument of social inclusion. |
 | Safety and comfort It is critical to the safety and comfort of the cycling network. |
 | Economic value Supplying updated information and monitoring the number of trips will help stakeholders invest in future projects to increase the cycling network. |
 | Awareness and acceptability It will support identifying the target population for new cycling promotion campaigns. Collecting cyclists data is an integral element in promoting a cycling network. |
Legend:
| Very positive | Positive | Neutral | Negative | Very negative |
2. Barriers
 | Legal No barriers. |
 | Finance Demands an adequate budget provision, which will always be substantially lesser than the budget needed for car infrastructure. Financing should be assured throughout the project development. |
 | Governance It must necessarily involve public traffic authorities and eventually agencies subcontracted for monitoring purposes or maintaining facilities. Some routes can be the responsibility of more than one municipality. |
 | Political acceptability Managing, monitoring, maintaining and implementing cycling facilities demands financial means that should be accounted for by planners, which can reduce political acceptance of these investments. |
 | Public acceptability Implementing, managing, monitoring and maintaining cycling facilities are critical to a good public acceptance. |
 | Technical feasibility The technical requisites to manage cycling facilities are not complex, but they should be based on multidisciplinary and specialized staff. |
Legend:
| No barrier | Minimum barrier | Moderate barrier | Significant barrier |
3. Costs
| Area | Measure | Unit | Cost | Implementation year |
| Albergaria-a-Velha, Aveiro (Portugal) | Rendering of technical services specialized in maintenance, development and monitoring of MOB.A project | 1 year | 17 000,00 € | 2019 |
| Maia, Porto’s Metropolitan Area (Portugal) | Acquisition and installation of monitoring equipment for cycling and pedestrian routes | 7 sensors | 28 053,00 € | 2017 |
| Lisbon, Lisbon’s Metropolitan Area (Portugal) | Elaboration of a study quantifying socioeconomic externalities in Public bike Sharing Systems | Defining algorithms for calculating positive externalities in bicycle trips, to include in the mobile app for the users of the public bike sharing service and for the elaboration of annual sustainability report of the first year in the operation (Socioeconomic analysis) | 25 000,00 € | 2017 |
| Sevilha, Andaluzia (Spain) | Maintenance contract | 3 years | 1 547 520,00 € | 2017 |
| Oficina de la Bicicleta | 4 years | 458 000,00 € | 2007 | |
| Comissão cívica | 4 years | 234 000,00 € | 2007 |
Case Study 1: Footway and Cycle Route Lifecycle Management Plan, Surrey (UK)

The Surrey County Council, in the U.K., has developed a “Footway and Cycle Route Lifecycle Management Plan” to ensure that the whole network is maintained to a standard consistent with their use and also to improve its condition and safety, as required, through a managed process. The plan includes: the inventory of data on footway and cycle routes; condition assessment through inspection; the establishment of service standards; performance monitoring; asset valuation; budget considerations; performance gaps; risk assessment; routine maintenance plan; upgrading plan; disposal plan for routes that have been designated ‘surplus to requirement’; commitment to sustainable development.
Learn more: www.surreycc.gov.uk/__data/assets/pdf_file/0020/38702/STAMP_Ch10.pdf
Impact:
 | Mobility system efficiency Directly contributes to the efficiency of the overall mobility system. |
| Livable streets The integrated management of pedestrian and cycling networks promotes their adequate use by several users, promoting livable streets. |
| Protection of the environment All services and works associated to the management of pedestrian and cycling networks in Surrey are required to contribute to the city’s goal of promoting sustainable development in the county, based on their “Common Agenda” |
| Inclusion, equity and accessibility The plan contributes to making cycling safer and more accessible to all, taking into account that cyclists are particularly sensitive to surface defects and debris. |
| Safety and comfort Ensuring that all sidewalks and cycling networks are maintained to a standard consistent with their use improves their safety and comfort. |
 | Economic value Even though there aren’t systematic evaluations, the integrated management of sidewalks and cycling networks throughout the county may promote economic gains due to time savings and health benefits and may also encourage new economic initiatives. |
| Awareness and acceptability The integrated management of sidewalks and cycling networks contributes to raising awareness and increasing cycling. |
Case Study 2: Bike Program Sevilla 2020 (Spain)

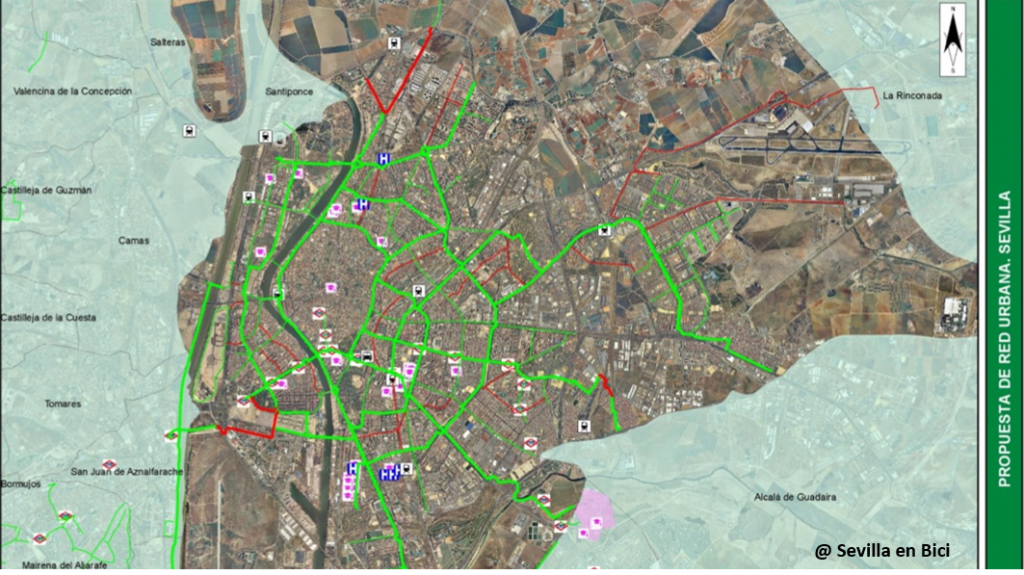
In 2004, Seville initiated an ambitious process of promoting the bicycle as a transportation mode, with a strong initiative of creating a dense cycle network, reaching a modal split of over 8% (2017). To consolidate and increase the results, the “Bicycle Programme Seville 2020” defines among its priority axes the maintenance and resolution of problems in the current cycling network, namely at the level of routes directions, pavement, street marking, awareness-raising, and setting specific criteria for the maintenance contract of the cycle network. Simultaneously, the programme established the elaboration of guides on behaviour and coexistence among cyclists and other users.
Learn more: http://www.sevilla.org/sevillaenbici/pdf/Programa%20de%20la%20bicicleta%20Sevilla%202020.pdf
Impact:
| Mobility system efficiency The overall programme expects to reach a 15% modal split for the bicycle. |
| Livable streets The programme frees part of the public space previously occupied by automobile circulation, promoting a human scale city and more livable streets. |
| Protection of the environment The programme contributes to improve air quality, reducing car’s CO2 emissions. |
| Inclusion, equity and accessibility The programme contributes to making cycling safer and more accessible for all. |
| Safety and comfort The programme evaluates and corrects problems in the existing cycling network, striving to improve safety and comfort. |
| Economic value No data on this specific impact has been found, yet the consolidated compromise with the bicycle may encourage new economic initiatives. |
| Awareness and acceptability The programme intends to manage cycling facilities as to increase awareness and attract new bicycle users. |
Case Study 3: Bicycle Barometer, Bolzano (Italy)
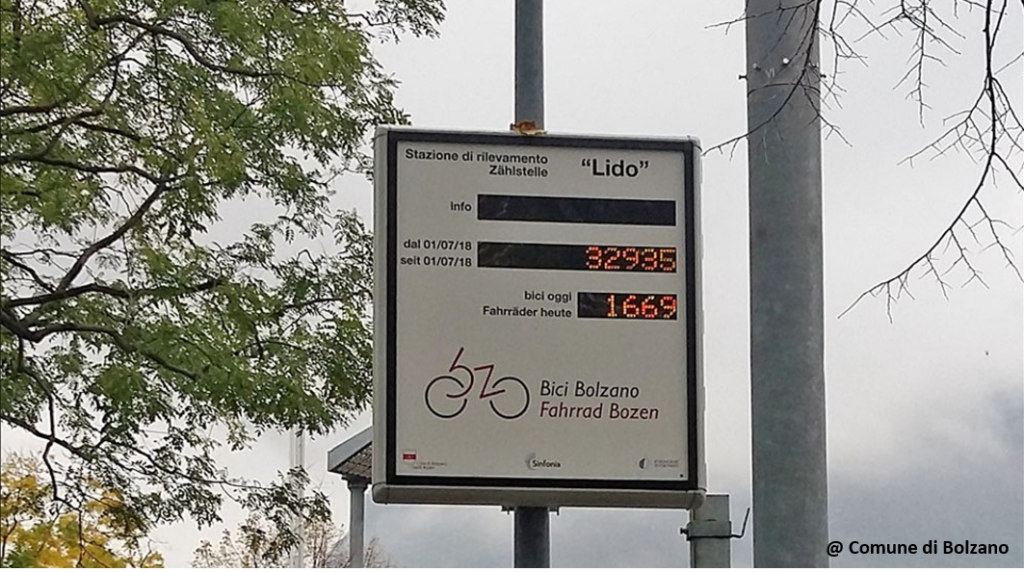
After landmark cities in Sweden, Norway Denmark, in 2006 the Mobility Department of the city of Bolzano installed the first Italian “bicycle barometer” on one of the main bike lanes of the city with the support of the VIANOVA Project. The display shows the total number of bikers (in both directions) on the present day and since the day when the device was installed. The measure relies on the recognition that sustainable mobility and the option for cycling is also a cultural matter and that biking has to become and to be perceived as a mobility system, with the same dignity and importance as the other transportation systems in a city. The main goal is getting people aware (and surprised) how many cyclists are actually passing through this measurement point, which will lead to a better identification with the bike mobility in the city as a system and getting people to cycle more. At the same time, it gathers data that are essential for R&D and policymaking. The action is part of a comprehensive strategy of the local administration that lead in the past years to the development of a bike network (with 8 main routes), a new logo and the creation of a whole corporate design covering all aspects and all activities of bike mobility in Bolzano.
Impact:
| Mobility system efficiency The city of Bolzano is constantly improving its bike modal split that is now close to 25% on annual average, and this measure contributes towards that by leading to a better identification with cycling as a mobility system and getting people to cycle more. |
 | Livable streets The measures has direct impacts on people’s perceptions and potentially has a contagious effect, getting more people to cycle and promoting more livable streets. |
| Protection of the environment The increased perception of cycling as a mobility system and the increased bike modal split have a significant contribution to the environment. |
| Inclusion, equity and accessibility The increased perception of cycling as a mobility system promotes the quality of life of all citizens. |
 | Safety and comfort The measure has no direct effect on safety, but contributes to the general awareness on cycling and helps city policymakers to make decisions that consider all those biking citizens. The numbers produced by the bike barometer also have the effect of boosting bicyclists’ confidence by showing that they are not alone. |
| Economic value The measure allows to account for the economic value of cycling and to encourages different economic initiatives around bicycle. |
| Awareness and acceptability The bike barometer shows the wider public how numerous cyclists are in a city and thus raises awareness and breaks resistance to cycling as a serious transport mode. It is also a visible symbol of the city’s commitment to cycling. |
Legend:
| Very positive | Positive | Neutral | Negative | Very negative |
Ayuntamento de Sevilha (2007). Plan director para el fomento del transporte en bicicleta. Sevilla 2007-2010. Available at: http://www.sevilla.org/sevillaenbici/plandirector/planbicisevilla.html
ANSR – Autoridade Nacional de Segurança Rodoviária (2014). Guia do Condutor de Velocípede. Available at: http://www.ansr.pt/SegurancaRodoviaria/Publicacoes/Documents/GUIA%20CONDUTOR%20VELOC%C3%8DPEDE.pdf
CROW (2016). Design Manual for Bicycle Traffic. Ede: Crow.
Marin (2019). Share the path. Available at: http://sharethepathmarin.org/
IMPIC. Base: Contratos públicos online. Available at: http://www.base.gov.pt/Base/pt
Karen, B. (2014). The Magic of Bike Barometers. People for bikes Blog. Available at: https://peopleforbikes.org/blog/the-magic-of-bike-barometers/
Parkin, J., Wardman, M., & Page, M. (2008). Estimation of the determinants of bicycle mode share for the journey to work using census data. Transportation, 35(1), 93–109. Available at: https://doi.org/10.1007/s11116-007-9137-5
PRESTO. Promoting Cycling for Everyone as a Daily Transport Mode (2010). Bike Counters. 25 PRESTO Implementation Fact Sheets. Available at: https://ec.europa.eu/energy/intelligent/projects/sites/iee-projects/files/projects/documents/presto_fact_sheet_bicycle_baromoters_en.pdf
Segadilha, A. & Sanches, S. (2014). Identification of factors that influence cyclists´ route choice. Procedia – Social and Behavioral Sciences, Volume 160, p. 372 – 380.
Savan, B., Cohlmeyer, E., & Ledsham, T. (2017). Integrated strategies to accelerate the adoption of cycling for transportation. Transportation Research Part F: Traffic Psychology and Behaviour, 46, 236–249. Available at: https://doi.org/10.1016/j.trf.2017.03.002
SUSTRANS (2014). Maintenance and management of routes for cyclists (draft). Sustrans Design Manual. Available at: www.sustrans.org.uk/our-services/what-we-do/route-design-and-construction/route-design-resources/maintenance-walking-and
Sustrans (2011). Road Safety Audits, Technical Information Note 23. Available at: www.sustrans.org.uk/sites/default/files/images/files/migrated-pdfs/Technical%20Note%2023%20-%20Road%20Safety%20Audits.pdf
TfL (2018). Temporary traffic management handbook. Available at: tfl.gov.uk/info-for/suppliers-and-contractors/health-safety-and-environment/traffic-management
VTPI. Victoria Transport Policy Institute (2018). Managing Non-motorized Facilities: Best Practices For Managing Sidewalks and Pathways. Online Transportation Demand Management (TDM) Encyclopedia. Available at: http://www.vtpi.org/tdm/tdm108.htm