The tool Gross Potential for Cycling (GPC) aims to identify the areas with the higher and lower potential for cycling in relation to the target-population, given their willingness to cycle, and the target-areas, due to their built environment, land use and geographic conditions.
Considering the specificity of starter cycling cities, this method looks at the gross potential, rather than assessing the level of existing cycling infrastructure. By assessing the areas with higher potential, the tool supports starter cycling cities in deciding where to begin cycling investments, increasing the initial chances of success. Progressively, other areas and routes can follow, targeting an integrated, inclusive, city-wide network.
In addition to detailed maps, the tool under development will produce an average GPC, allowing to position the city in a national ranking of cycling potential.
Cycling potential ranking
| Position | Municipality | Score | Populational Density |
| 1º | Porto | 4,08 | Very High (5 976 residents/km2) |
| 2º | Tavira* | 3,91 | Low (43 residents/km2) |
| 3º | Beja* | 3,78 | Low (31 residents/km2) |
| 3º | Lisbon | 3,78 | Very High (6 448 residents/km2) |
| 5º | Portimão | 3,69 | Medium High (305 residents/km2) |
| 5º | Amadora | 3,69 | Very High (7 367 residents/km2) |
| 7º | Matosinhos | 3,59 | Very High (2 811 residents/km2) |
| 8º | Vila Nova de Gaia | 3,57 | Very High (1 794 residents/km2) |
| 9º | Trofa | 3,55 | High (542 residents/km2) |
| 10º | Gondomar | 3,53 | Very High (1 274 residents/km2) |
| 11º | Odivelas | 3,51 | Very High (5 484 residents/km2) |
| 12º | Valongo | 3,50 | Very High (1 249 residents/km2) |
| 13º | Maia | 3,48 | Very High (1 627 residents/km2) |
| 14º | Loures | 3,42 | Very High (1 211 residents/km2) |
| 15º | Oeiras | 3,40 | Very High (3 751 residents/km2) |
| 16º | Fundão | 3,32 | Low (41 residents/km2) |
| 17º | Santa Maria da Feira | 3,18 | High (645 residents/km2) |
| 18º | Machico | 3,14 | Medium High (319 residents/km2) |
| 19º | Marco de Canaveses | 3,09 | Medium High (264 residents/km2) |
| 20º | Condeixa-a-Nova | 2,93 | Medium (123 residents/km2) |
| 21º | Chamusca | 2,70 | Very Low (13 residents/km2) |
*Only the central city was analysed in this case, not the entire urban area.
They are organized by their average Gross Cycling Potential score (1-5). Each municipality is classified according to their populational density in comparasion to the portuguese panorama:
Very High > 1000 residents/km2
1000 > High > 500 residents/km2
500 > Medium High > 200 residents/km2
200 > Medium > 100 residents/km2
100 > Medium Low > 50 residents/km2
50 > Low > 20 residents/km2
Very Low < 20 residents/km2
To access the detailed maps, click on the name of the municipalities.
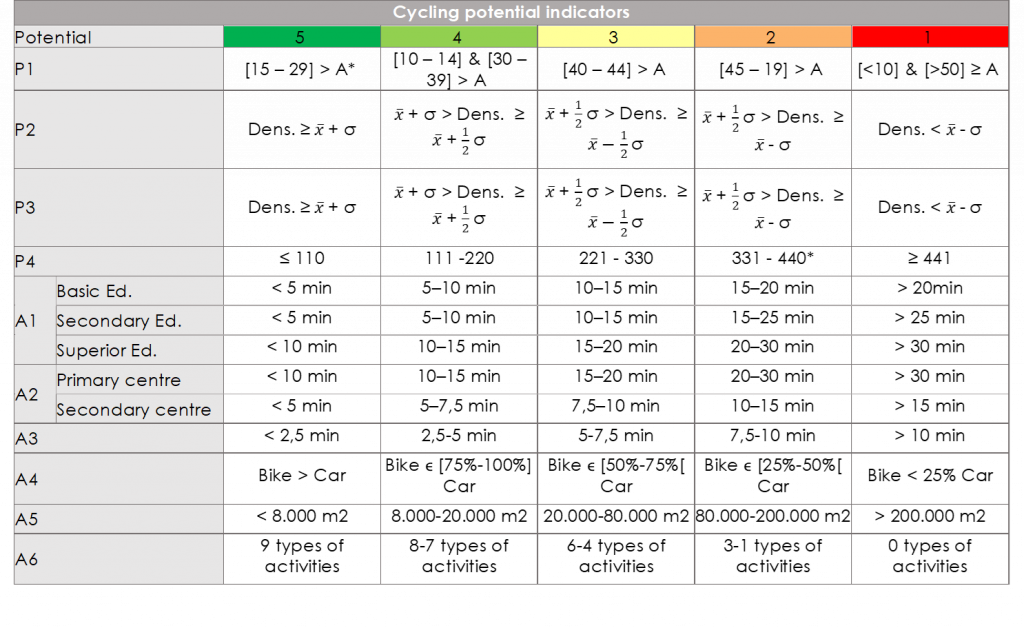
The method is based on a set of ten indicators that reveal physical characteristics of the built environment and population conditions, recognized at an international level as influential to cycling mobility. A map is produced for each indicator, classifying the territory in the analysis (typically a municipality or a set of municipalities) in a scale of 1 (lesser cycling potential) to 5 (greater cycling potential).
Thus, the spatial dimension is given particular importance in the analysis of the cycling potential, allowing the identification of the areas with more and less facility to this transport means, regardless of the average potential of the territory in the analysis.
The ten indicators are gathered in an aggregated map of the gross potential for cycling and in an average aggregated value of the same potential (population-weighted average). The aggregated map results in the weighted average of the previous ten maps, using as weights the values indicated in the figure above. These weights are based on the scientific consensus relative to the impact of each indicator on the promotion of the bicycle as a transport means. The more relevant the indicator, the greater its weight.
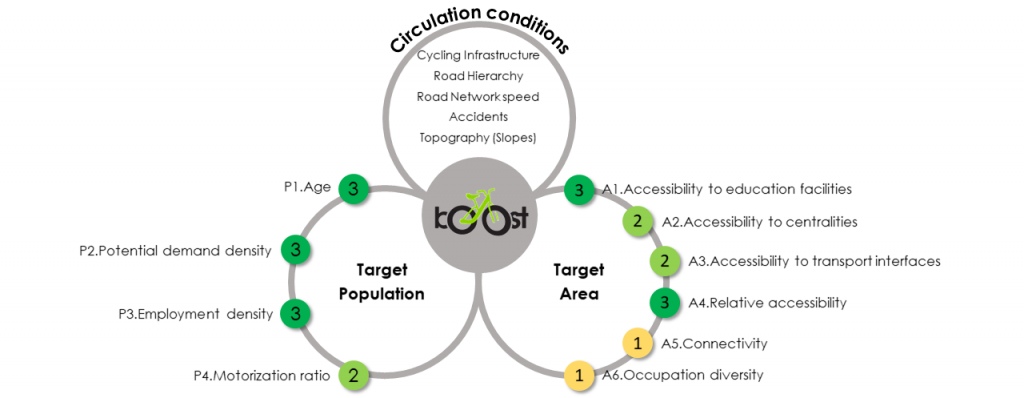
P1|Age: identifies the areas where more people with ages prone to cycling reside. The average of each age segment in each statistical subsection is compared to the municipality’s average (*A).
P2| Potential demand density: identifies the areas with a greater density of people whose travel distances are prone to cycling (1,6 – 8km).
P3| Employment density: identifies the areas with more workers.
P4| Motorization rate: identifies the areas with more driving residents. This value is used as a proxy for car ownership and compared to the national average (*440 cars/resident).
A1| Accessibility to education facilities: identifies the areas prone to cycling as a means to access education facilities.
A2| Accessibility to centralities: identifies the areas prone to cycling as a means to perform day-to-day trips (shopping, leisure, etc.).
A3| Accessibility to transport interfaces: identifies the areas prone to cycling as a complement to the commute (first and last mile).
A4| Relative accessibility: classifies the municipalities’ urban area according to the average distance a bicycle can circulate in a determinate time in comparison to a car’s average distance in the same period.
A5| Connectivity: identifies the areas with more blocks with adequate cycling dimensions.
A6| Occupation diversity: identifies the areas with a greater diversity of commerce and services.