
1. Presentation
Diversity of programmes and activities, involving information, education and awareness raising to support and promote cycling. Besides general information campaigns and support on cycling, any mobility management measure should be followed by a specific information measure to clarify it.
2. Objectives
- Providing information so that people feel aware and able to cycle;
- Producing knowledge on the reality of cycling to capacitate cycling promotion organizations and local authorities;
- Giving users more confidence by indicating the best routes to travel from point A to point B;
- Encouraging more people to take up cycling, breaking existing resistance at public, political and technical levels and increasing its social acceptability;
- Mobility paradigm shift.
3. Measure’s importance
In starter cycling cities, the promotion of change towards an increased social acceptability and normality of cycling is a continuous and complex process, in which information and awareness measures are essential to act upon the involved social and cultural factors and to respond to the different motivations and barriers within targeted groups. At the same time, “soft” measures promote the effectiveness of “hard” measures such as investment in cycling infrastructure.
1. Good Practices
– Information is a measure that must be present in any package of measures, contemplating both general information about cycling and specific information for each measure implemented.
– Information actions should avoid to centre the debate on the car and its potential losses and, on the contrary, focus on conveying a clear, consistent and positive message about cycling benefits for all and its relation with the specific local agenda.
– It is important to identify and address the main barriers to cycling in each specific location and to segment different target -groups (children, parents, teenagers, drivers/ non-cyclists, occasional cyclists, persons with reduced mobility, elderly, etc.).
– For the success of information actions, it is essential to ensure good cycling conditions and safety.
– It is essential that local authorities and cycling promotion organizations become knowledgeable about the topic and reliable in providing information to their target-population.
– Involvement and partnerships with community groups and organizations, that have prior relationships with the defined target groups, allow to expand the exposure and visibility of information actions, through complementary sources already familiar to the target population, fostering programme sustenance.
– These types of measures should be implemented regularly and for an extended period of time.
– Information action should seek to mobilize and bring local actors closer, generating trust and complicity, which are fundamental conditions to support behaviour change.
2. Actions
 | Different support information for cycling Provision of tailored guidance and information (brochures, letter, posters, fact sheets, manuals, website, newsletter, hotline number, exhibition, cycling/mobility information centres, etc.) on cycling, the cycle policy of the city council/ organization, the development of the cycle network, suggestions for cycling and general tips. Learn more: Sidney Cicleways – initiative that the City of Sydney has been running since 2011 to provide information on cycling in the city (including maps, cycling courses, festival, facilities) and raising awareness amongst the varied users of shared paths. Bicycle account – periodic publication from the city of Helsinqui reviewing the evolution of cycling levels in the city, resident opinions, new cycling projects and services. |
 | Bike maps and routes Bicycle maps are a “must have” component for promoting cycling; they should depict the local bicycle lane network and also give recommendations for routes, the quality of paths, the volume of traffic, bicycle parking, and existing cycling facilities/ services. A high quality bicycle map also provides information about various related topics such as safe cycling in the urban context or relevant bicycle signage. Note: Collecting the data for a city’s first bike route map can be a large task. Different information resources may be needed to accommodate different types of users, including special versions for people with disabilities and possibly different languages. Learn more: CRD bike map – aims to encourage bicycle commuting through updated maps accessible online (PDF) and in pocket-sized format available at different places, including a comfort level index that helps riders to choose more comfortable and pleasant routes. |
 | Trip planning systems Web-based platforms and GPS apps reach people through their computers, cell phones and tablets, with navigation tools and tailored and timely information. They may focus on a specific transport mode (in this case, the bicycle) or a multimodal combination (for instance, bicycle and public transport), providing information before, during and after the trip. Trips may be optimized according to different criteria, depending on the system, such as the quickest route (both in time and distance), the cheapest or the safest (which is particularly important for cycling, for example to avoid high traffic/ speed roads). Advantages: Make cycling more efficient by presenting the safest routes. Can help to overcome barriers to cycling associated with perceived unsafety due to road traffic by providing alternative routes with positive consequences on cycling levels. Making cycling fun and self-reinforcing through technology, sending incentives, pledges, rewards, peers support and socializing through these platforms. Disadvantages: The system efficiency is dependent on the quality of the data they use (e.g. data on the quality of pavements and cycle paths is very difficult to obtain on a large scale). Mobile apps have the potential to distract or confuse cyclists. Learn more: Bike Citizens; Biklio (both available in some Portuguese cities). |
In Usti nad Labem, Czech Republic, the city government used a radio programme to disseminate information about the new mobility plan that was being implemented. The programme consisted of 2 news items, disseminated through interviews with the team members coordinating the plan.
The program was recorded and broadcasted by the Cesky Rozhlas regional public radio station during a programme related to city events. Therefore, the municipality was not charged to make it. However, a radio programme is only part of an information campaign. It needs to be complemented by additional media to be noticeable and reach out to different community groups.
1. Impacts
 | Mobility system efficiency The provision of cycling information has impacts on the mobility system efficiency, allowing a growing awareness of the various users and promoting the increase of cycling modal share and the more efficient use of streets. |
 | Livable streets Information and awareness on cycling promote a better use of public space and streets and a better coexistence among all users, fostering more livable streets. |
 | Protection of the environment The provision of cycling information should include a clear message on cycling benefits, particularly at the environmental level, contributing to raising environmental awareness and protection and to the change of practices. |
 | Inclusion, equity and accessibility Information programmes and trip planning systems contribute towards an increased accessibility to activities and services. At the same time, when segmented and tailored to the needs of different target-groups (children, parents, drivers/non-cyclists, people with disabilities, elderly, women), promote increased social equity. |
 | Safety and comfort Adequate information contributes to raising awareness on cycling among all (drivers, cyclists, pedestrians) and to changing behaviours towards increased safety and comfort to all. |
 | Economic value Increased information and awareness on cycling may contribute to raising the economic value of cycling and to improve the economy of city centres. There is no data linking bicycle information programmes with economic gains, but they can indirectly contribute to increasing the economic value of bicycles and boosting the economy of city centres. |
 | Awareness and acceptability Information programmes are essential to breaking resistance to cycling, promoting its social acceptability and contributing to a paradigms shift. |
Legend:
| Very positive | Positive | Neutral | Negative | Very negative |
2. Barriers
 | Legal There are no legal barriers to the provision of information programmes. In the case of trip planning systems and other electronic tools, issues may be raised concerning data privacy legislation. Ultimately, increased information dissemination on cycling will lead to a shift in the dominant mobility paradigm demanding structural reallocation of infrastructures and changes to traffic regulations and the overall legal framework. |
 | Finance The implementation of information programmes is demanding in terms of costs, both in the production of content and in improving its attractiveness (design and communication); In addition, they must be carried out and reinforced on a continuous basis, requiring constant funding. |
 | Governance May involve public authorities and, potentially, companies/employers, cycling movements and other organizations that have pre-existing relationships with the defined target-groups. A broad commitment is needed to offer these sort of measures regularly for an extended period of time. |
 | Political acceptability Though measures for cycling usually get less priority than those for motor vehicles, it is expected that information programmes will not offer special political resistance. Even so, the fact that only a small part of the population commutes by bicycle (0.5% in Portugal) removes its electoral and claiming power. |
 | Public acceptability It is expected that information programmes will have good public acceptability; however, the absence of good cycling conditions and road safety can be a serious barrier for the success of this measure. |
 | Technical feasibility Information programmes do not offer technical barriers. Maps and trip planning systems require specific know-how to be develop (or subcontracting private operators). |
Legend:
| No barrier | Minimum barrier | Moderate barrier | Significant barrier |
3. Budget
| Area | Measure | Unit | Cost | Implementation year |
| University of Porto, Porto Metropolitan Area (Portugal) | Purchase of kits (manual/ brochure on the project, bike puncture repair material and reflective material) | 265 kits | 11 447,15 € | 2018 |
| Porto, Porto Metropolitan Area (Portugal) | Acquisition of services for developing a mobile application for public transport use, route planning and public information | 140 625,01 € | 2017 | |
| Cascais, Lisbon Metropolitan Area (Portugal) | Acquisition of two bike counters | 2 bike counters for 2 years | 33 080,00 € | 2018 |
| Seville, Andalusia (Spain) | Communication strategy | 3 years of activity | 60 000,00 € | 2007 |
Case Study 1: Personalized Travel Planning (PTP) – Cycle, Burgos (Spain)
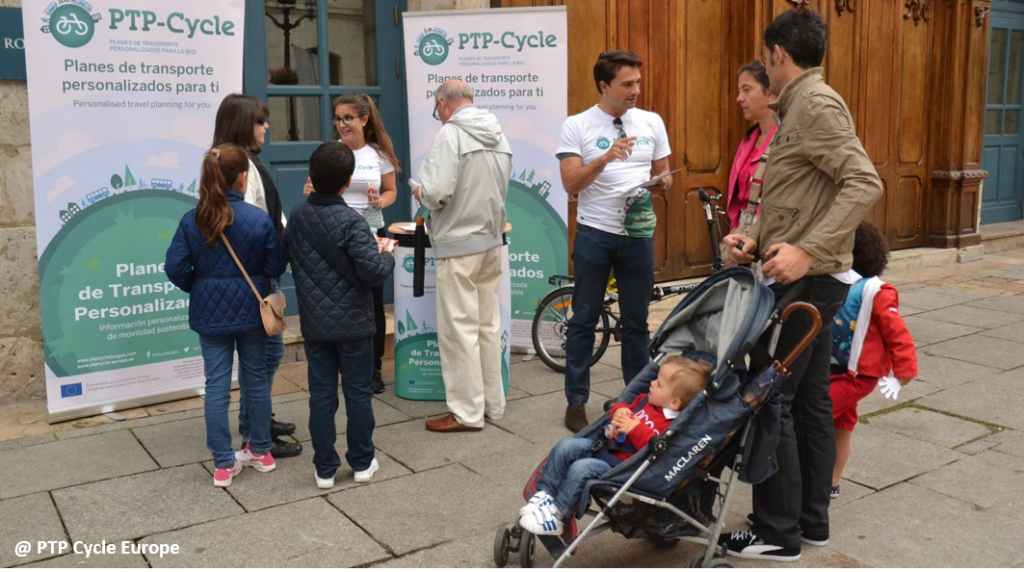
Burgos is a Spanish starter cycling city that, since 2005, has worked to increase the number of cyclists by providing new cycling facilities, a bicycle loan system and multiple marketing and dissemination activities. Currently, Burgos has the second highest use of bicycles for daily commuting trips in Spain (nearly 4%). The City Council of Burgos is a partner in the European PTP-Cycle project that uses Personalized Travel Planning (PTP) to promote a modal change from the individual car to other more sustainable means with a focus on bicycle. Instead of general information, PTP provides personalized data to the citizen on the sustainable mobility options through planning with a PTP advisor, available in different places in the city or directly visiting the households. PTP-Cycle also provides a holistic approach to support cities, companies and universities in developing their own PTP processes.
Learn more: ptpcycle-europe.eu; https://ptpcycleburgos.com/
Impact:
| Mobility system efficiency The PTP-Cycle project in Burgos has directly increased transport network efficiency, delivering a 11% increase in the number of cycling trips for everyday general trips and a 24% increase in the number of cycling trips from work to home; only 2% of people use their car as frequently following a visit, with the remaining 98% reducing private car use, and increasing use of a bike or public transport, or walking. |
| Livable streets The face-to-face approach of PTP-Cycle project and the increase in the number of cycling and walking trips contributes to a more livable city. |
| Protection of the environment The modal shift results of the PTP-Cycle project induced following environmental benefits: reduction of fuel consumption; decrease of kilometres travelled by car; reduction of CO2 emissions; reduction in traffic noise. |
 | Inclusion, equity and accessibility By providing personalised travel plans, PTP-Cycle addresses the needs of different populations, including those with special needs. For promoting increased social equity it should target the diversity of city’s neighbourhoods and particularly the most disadvantaged ones. |
| Safety and comfort The personalised travel plans provide guidance on safety. |
 | Economic value The impacts of PTP-Cycle can provide employment opportunities for local residents by better connecting them to jobs. For those on low incomes, even public transport maybe too expensive and instead cycling provides a cheaper alternative to commute. PTP can also generate revenue for local shops and businesses such as purchases of bikes and other equipment. |
| Awareness and acceptability 29% of the residents responded that the information received about cycling has made a permanent change to their attitude towards cycling and their perception of using a bike as a normal mean of transport. |
Case study 2: Bike routing service of the SenseMyFEUP app (Porto, Portugal)
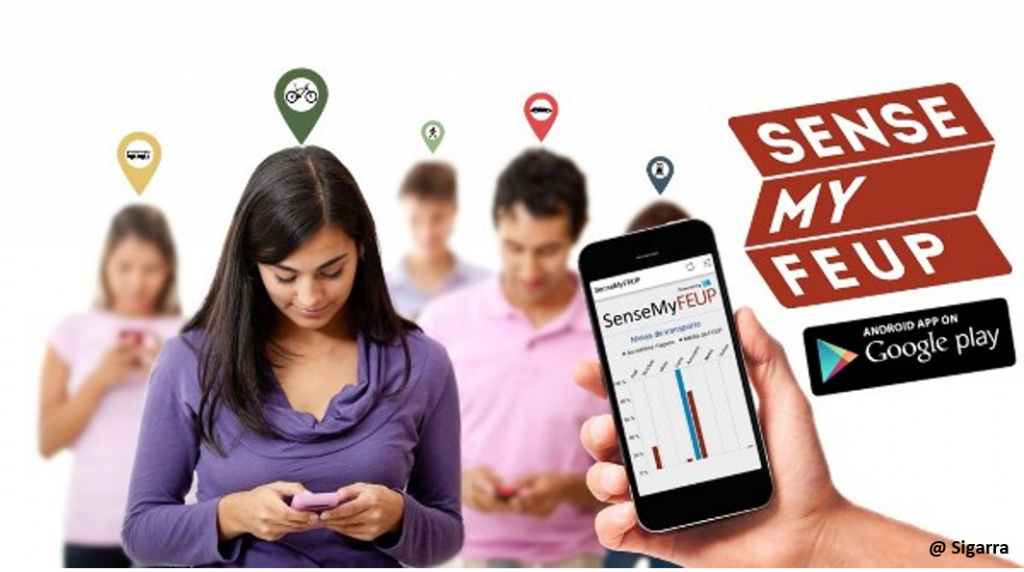
Introduced in 2016, the SenseMyFEUP app was developed for Android smartphones, using crowdsensing systems for data collection, with the objective of assessing the mobility patterns and subsequent carbon footprint of the Faculty of Engineering of the University of Porto (FEUP), and later the entire University of Porto (UP). In 2018 the app was updated with the addition of a bike routing service (as well as public transport schedules), through the open-source software BBBike. In addition to providing the trip’s length and estimated duration, the system also allows the user to set the desired cycling speed, preference for residential streets, main streets or streets with cycling infrastructure or bus lines. In addition, it allows the user to choose the surface (avoid cobbled streets) and even avoid poorly lit streets.
Learn more: sensemycity.up.pt/project/sensemyfeup/; www.bbbike.org/
Impact:
 | Mobility system efficiency Cycling still has a residual use in FEUP and UP communities (<1.5% according the University mobility survey of 2019), so this app can boost cycling trips by allowing bike routing. As a major trip generation pole in Porto city, the measure contributes to the efficiency of the city’s transport system. |
 | Livable streets In 2019, the university mobility survey revealed that 41% of its community used the car as the main mode of transport. As such, the system has the potential to increase cycling trips which will bring societal benefits. |
 | Protection of the environment With a significant part of the UP’s community using the car in their trips (41% in 2018), any increase in cycling trips due to the app will lead to environmental gains. |
| Inclusion, equity and accessibility Transport costs are an important barrier particularly for students. By providing cycling routes, the app can increase its use, with gains in accessibility and equity (cycling is one of the most affordable modes of transport). |
| Safety and comfort By providing route options that go through quieter zones, this system is especially important for beginner cyclists, increasing their comfort and safety. |
| Economic value No data. |
 | Awareness and acceptability This system supports the normalization of cycling, with particular relevance for inexperienced cyclists as it provides safe routes that will increase their confidence in cycling. |
Legend:
| Very positive | Positive | Neutral | Negative | Very negative |
Curtis, P. & Mouncher, K. (2016). Delivering Personalized Travel Planning across Europe: PTP-Cycle Final Report. Accessed 2 July 2019. Available at: www.ptpcycle-europe.eu
DfT (2007). Making Personal Travel Planning Work: Research Report. Accessed 2 July 2019. Available at: https://webarchive.nationalarchives.gov.uk/20101007203323/http://www.dft.gov.uk/pgr/sustainable/travelplans/ptp/makingptpworkresearch.pdf
Dickinson, J. E., Kingham, S., Copsey, S., & Hougie, D. J. P. (2003). Employer travel plans, cycling and gender: will travel plan measures improve the outlook for cycling to work in the UK? Transportation Research Part D, 8, 53–67. Accessed 2 July 2019. Available at: https://doi.org/10.1016/S1361-9209(02)00018-4
FEUP (2018). Curso de formação contínua em Gestão da Mobilidade (Portugal) destinado a técnicos de Planeamento. Accessed 2 July 2019. Available at: https://sigarra.up.pt/feup/pt/cur_geral.cur_view?pv_curso_id=10301.
Gössling, S. (2013). Urban transport transitions: Copenhagen, City of Cyclists. Journal of Transport Geography, Vol. 33, 196-206. DOI: 10.1016/j.jtrangeo.2013.10.013.
IMPIC. Base: Contratos públicos online. Accessed 20 July 2019. Available at: http://www.base.gov.pt/Base/pt
KonSULT (2016). Trip Planning Systems. Accessed 24 Januart 2019. Available at:: http://www.konsult.leeds.ac.uk/pg/68/
Paul, F., Bogenberger, K. & Fink, B. (2016). Evaluation of Munich’s Cycle Route Planner Data Analysis and Customer Survey. Transportation Research Procedia, Volume 19, p. 225 – 240.
PRESTO. Promoting Cycling for Everyone as a Daily Transport Mode (2010). Targeted adult cycling training programmes. 25 PRESTO Implementation Fact Sheets. Accessed 2 July 2019. Available at: https://ec.europa.eu/energy/intelligent/projects/sites/iee-projects/files/projects/documents/presto_fact_sheet_adult_training_programmes_en.pdf
PRESTO. Promoting Cycling for Everyone as a Daily Transport Mode (2010) Bicycle Maps. 25 PRESTO Implementation Fact Sheets. Accessed 2 July 2019. Available at: https://ec.europa.eu/energy/intelligent/projects/sites/iee-projects/files/projects/documents/presto_fact_sheet_bicycle_maps_en.pdf
Pucher, J., Dill, J., & Handy, S. (2010). Infrastructure, programs and policies to increase bicycling: An international review. Preventive Medicine, 50, S106–S125.
Savan, B., Cohlmeyer, E., & Ledsham, T. (2017). Integrated strategies to accelerate the adoption of cycling for transportation. Transportation Research Part F: Traffic Psychology and Behaviour, 46, 236–249. https://doi.org/10.1016/j.trf.2017.03.002
Rantala, T; Metsäpuro, P. ; Luukkonen, T.; Karhula, K.; Vaismaa, K.; Mäntynen; J. (2014). Vitality from Walking and Cycling. Accessed 2 July 2019. Available at: http://www.tut.fi/verne/aineisto/PYKALA-II-English_Book_Low_Quality_v2.pdf