
1. Presentation
Road user charging is the fee charged for using a vehicle in an urban area. It belongs to the category of road charging measures, which includes road tolls, distance or time based pricing and polluting vehicles pricing. Road charge is currently used to pay for infrastructure costs, but it is important to point out that that motivation may sometimes present consequences contrary to sustainable mobility (i.e. when pricing is abolished in higher traffic areas, inside urban areas). As an incentive to bicycle use, it is important to mention congestion fees, which aim at influencing traffic volume and discouraging the use of congested streets in moments of higher pressure.
2. Objectives
There is a wide range of design options which allow the measure to serve the objectives of several policies:
- Congestion reduction and optimization on the transport system,
- Improving air quality ad reducing pollution;
- More quality of life and road safety.
- In the context of starter cycling cities, generated income should be used to promote modal split.
3. Measure’s importance
Charging fees in urban streets pushes people to change their behaviour regarding individual transport, encouraging changes in trips schedule and itinerary in relation to peak and congested times and environmentally sensitive areas. It reduces the general level of car use, either by shifting from car to other means of transport, or by reducing the amount of car trips. Therefore, implementing this kind of changes is important to an efficient mobility, while the generation of income can contribute to financing an integrated local transport strategy.
1. Good Practices
– These measures are usually more indicated for cities with high road traffic levels, or cities with large dimensions. Even in small cities, this is a measure to consider, especially if they have a highway collecting system to finance infrastructure. Pricing to finance infrastructure usually follows principles contradictory to sustainable mobility ideals, often eliminating fees in the most congested areas, when it should be the reverse.
– Choose pricing methods that can be implemented economically and in a convenient manner for users. They should reflect more accurately the costs of each trip.
– Use fees that vary over time, with higher rates during peak times and vice-versa, to reduce congestion.
– Apply congestion prices in existing roads, not just new installations.
– Avoid substantial discounts to frequent users, since it contradicts the objectives of pricing.
– Push the development of alternative travel options, including flexible schedules, carpooling and improvements in cycling conditions.
– Integrate prices with other strategies that increase travel options and supply incentives to alternatives means of transportation.
– Make sure that decisions on price are transparent, based on public participation and trust.
– Approach equity concerns, assuring that all groups receive benefits, be it be using discounts or better travel options.
– Establish predictable values.
– Monitor citizens’ adaptation to changes and reformulate measures to respond to users’ needs, without compromising sustainable ideals (See Management, monitoring and maintenance).
– Explain the principles behind the measures taken so that their need and functioning are clear (See Information).
2. Actions
| Road charging methods | |
 | Road toll A fee is charged to circulate in a specific road. This method is applied in particular roads, with the possibility of exemption for high occupancy vehicles. Disadvantages: It can deviate traffic to other non-charged roads. It’s rarely applied, except on highways, bridges and tunnels. |
 | Cordon charging A series of payment points is established in all the entrances for a determinate area (usually the city centre). Disadvantages: Introduces problems with the border. It can redirect traffic around the cordon and create congestion problems. The drivers can park outside of the cordon and walk, increasing environmental problems in the areas surrounding it. People inside the cordon won’t have to pay, creating social disparities. Those making long trips will have to pay the same amount as those making short trips. |
 | Area It’s a variant of the cordon methodology, where a fee is charged to use a vehicle inside an area, instead of being charged to enter it. Advantages : Allows controlling vehicles inside the established limits and not just those entering the ring. Disadvantages: Additional maintenance costs. Introduces problems with the border. |
 | Differentiated fees Charging in one or both directions of the cordon. Differentiated fees in different cordon areas. Differentiated fees by hour or by vehicle type. |
| Exemptions and Limitations Exemptions, or reduced fees, to specific types of users (for example, residents or disabled drivers). Limiting the amount that can be charged in a specific period (for example, a day or a month). |
| Technology | |
 | Manual road tolls Advantages: Reliable and accepted system. Act of payment and enforcement is combined into one. Disadvantages: Creates congestion in the toll areas and needs space to install the road tolls. |
 | Automatic number plate recognition It is primarily a technology for applying rates and not for charging them.. Advantages: More sophisticated technology, which simultaneously allows charging and application. Disadvantages: Needs urban furniture and may demand high costs. |
 | GPS/ GNSS Advantages: In development technology. Disadvantages: High unit cost and demand for urban furniture to apply fees. May have operational problems due to the urban conditions and nearby roads. |
 | Short range communication It is mainly a technology to charge fees (not yet available for application). Advantages: May be used in a variety of charging formats. |
 | Licenses Attributing circulation license. Advantages: Simple process. Disadvantages: Enforcement and control may be difficult. Limited number of possible classes. |
1. Impacts
 | Mobility system efficiency Charging fees to drivers contributes to the efficiency of the mobility system by discouraging car use and prioritizing more sustainable and efficient alternatives for the city. |
 | Livable streets By reducing the number of private vehicles in urban centres, it allows the space to be utilized in other ways, namely by prioritizing pedestrians and cyclists. The created income can also be utilized in interventions to improve urban space, making the streets more attractive and dynamic. |
 | Protection of the environment Reduces atmospheric and sound pollution and pressure on green spaces and environmentally sensitive areas. |
 | Inclusion, equity and accessibility It improves public transportation conditions and releases resources that can be used for the “greater good”, though equity effects depend on the way in which the income is applied. |
 | Safety and comfort Reduces traffic levels and thus the probability of traffic accidents. |
 | Economic value Frees potentially productive time lost in traffic congestions and allows transport operators rationalize their fleet operations. |
 | Awareness and acceptability By increasing the cost of car use, it contributes to increase the attractiveness of other transportation modes, including the bicycle, which will tend to be seen more as a transportation mode. |
Legend:
| Very positive | Positive | Neutral | Negative | Very negative |
2. Barriers
 | Legal Requires specific legislation in many countries. |
 | Finance Increases income. |
 | Governance It’s necessary to coordinate between authorities, particularly to avoid collateral damage. |
 | Political acceptability Highly controversial due to the strong opposition expected by drivers and other affected users. |
 | Public acceptability Any increase in car traffic cost is seen as unpopular. |
 | Technical feasibility Some systems demand complex technology. |
Legend:
| No barrier | Minimum barrier | Moderate barrier | Significant barrier |
3. Budget
| Area | Measure | Unit | Cost | Implementation year |
| U.K | Circulation licenses | Implementation | 30 – 50 millions £ | Information gathered in 2014 |
| Maintenance | 30 – 50 millions £ | |||
| Tag | Implementation | 85 millions £ | ||
| Maintenance | 55 millions £ | |||
| Smart Card | Implementation | 140 millions £ | ||
| Maintenance | 55 millions £ |
* Annual operating costs for the London scheme have turned out to be significantly higher than shown in the table above and currently stand at about £91 million per annum (TfL, 2008).
Case Study 1: The Area Licencing Programme (Singapore)
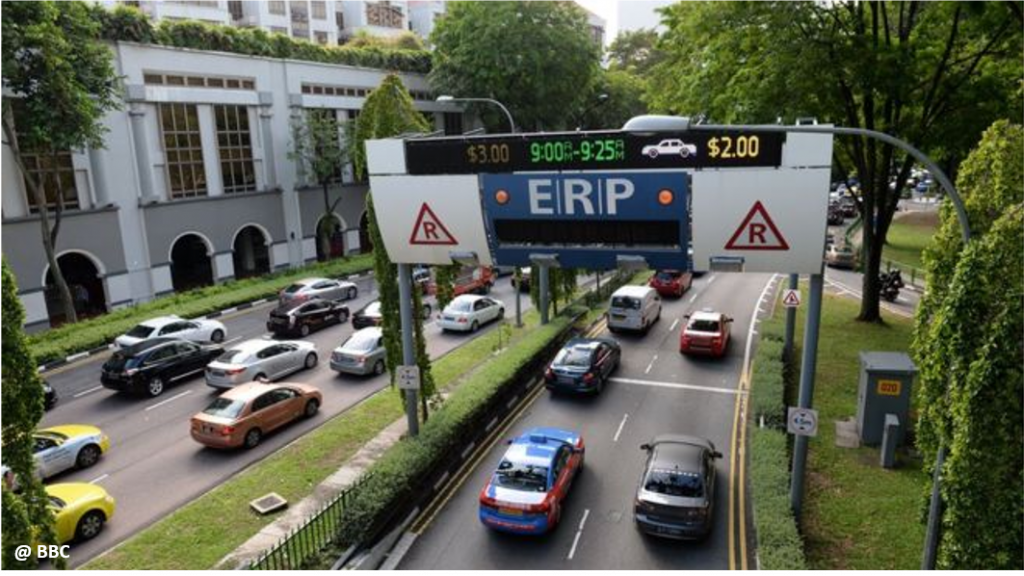
In 1975, the Area licencing Programme was introduced to reduce congestion in the city centre. The drivers had to by daily or monthly licenses to allow them to enter the defined area. The fee increased from 3 to 4 $ in 1976. Vehicles with 4 or more occupants were exempt. Police officers were placed in the 22 entrances to watch vehicles and register and apply fines to those circulating without a license. Posterior changes involved extending the programme to the evening peak, to the work schedule and to Saturdays; and a set of charging points on freeways and to all private vehicles, regardless of the number of occupants. Different fees were charged to different vehicles.
Impact:
| Mobility system efficiency The 44% reduction of incoming traffic to the city centre resulted in an increase in circulation speed of 22% in the centre and 10% on the approaches. Speeds dropped to 20% on the inner cordon road. A cost-benefit analysis was not conducted, but it is clear that there were substantial reductions in congestion costs and increases in benefits. It is possible that charges were, in practice, too high and that greater benefits could have been obtained with less car-use reduction. |
| Livable streets It mainly had an impact in business and trading in the city centre. Residential streets weren’t very affected, but the commercial district and streets achieved better conditions. |
 | Protection of the environment Since this wasn’t a main objective of the measure, the impacts weren’t evaluated. Yet, environmental quality should have improved in the city centre during the morning peak. However, There might have been a small environmental deterioration during the exemption periods and in the areas outside of the cordon. |
 | Inclusion, equity and accessibility Different studies reached separate conclusions. The first found little evidence of differentiated impacts and suggested that the varied alternatives offered by the programme reduced inequalities. However, a different study found that those with lower incomes suffered negative consequences. |
 | Safety and comfort Since this wasn’t a main objective of the measure, the impacts weren’t evaluated. Yet, safety and comfort should have improved in the city centre during the morning peak. However, There might have been a small environmental deterioration during the exemption periods and in the areas outside of the cordon. |
| Economic value An evaluation conducted 10 after the implementation of the programme didn’t found negative consequences, which were overcome by the economic expansion of Singapore. Businesses supported the programme. |
 | Awareness and acceptability No data. |
Case Study 2: London’s congestion charging (U.K.)
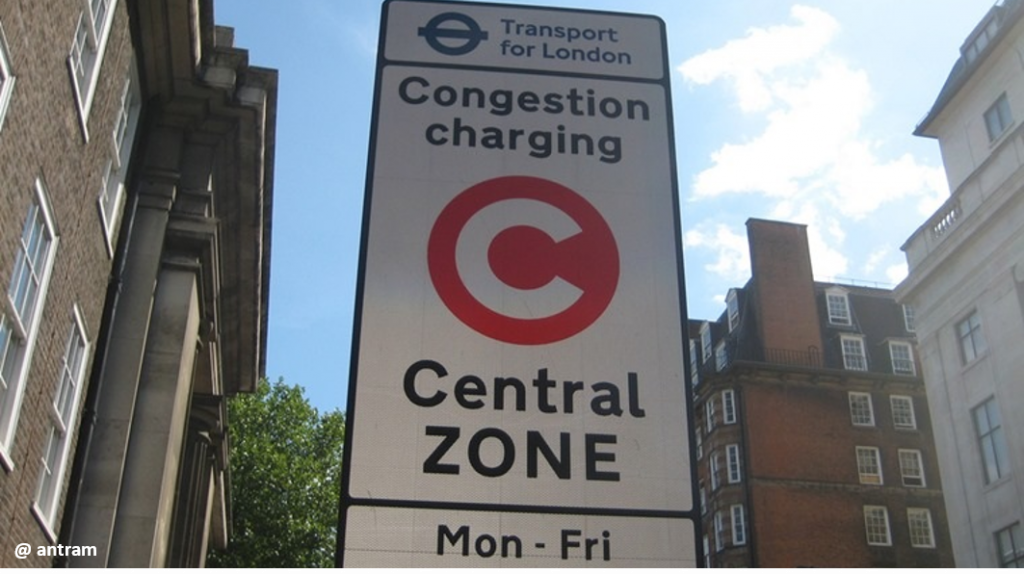
The congestion charging program was implemented in February of 2003. The original key elements were:
- Application between 07:00 and 18:30 in London’s central area;
- Cars, vans and trucks were charged 5,00 £;
- Exemptions included motorcycles, taxis, vehicles of disabled people, some alternative fuel vehicles, buses and emergency vehicles;
- Area residents had a 90% discount;
- Payments could be done on the internet, in pay booths in that area, through text messages and identified stores;
- Surveillance cameras automatically verify the plate number of the eligible vehicles circulating in and to the area. Plate numbers are automatically compared in the paying vehicles data base.
Impact:
 | Mobility system efficiency The substantial reduction in congestion with the transfer to more sustainable modes represents a big increase in economic efficiency. However, the operational costs are high and reduce the liquid economic benefits. Total benefits were of 200 million £ per year, with total costs, including extra buses, of 110 million £. This results in a liquid profit of 90 million £. However, Transport for London (TfL) values aren’t universally accepted, particularly in regards to time used, leading to a certain uncertainty over efficiency. |
| Livable streets There are several evidences that reduced traffic levels and the increase in pedestrian and cyclist’s priority zones represents a substantial increase in quality of life in the area. The increase in traffic in the surrounding areas didn’t constitute a problem. |
 | Protection of the environment Reducing traffic and congestion lead to a 15.7% reduction in CO2 in the area and to an 8.5% reduction in the interior circular road. Local pollutants in the area were reduced by 13% and 16% in NOx e PM10, respectively. Both pollutants were reduced by 7% in the interior circular road. |
 | Inclusion, equity and accessibility No direct evidence was presented in regard to social equity and inclusion, but the improvement in public transports, particularly bus services, cycling and walking; and the reduction in accidents are all factors that probably would benefit socially excluded citizens. |
| Safety and comfort Accidents are estimated to have dropped between 2.8% (60 accidents) and 6.5% (140 accidents) in the charged area and in the interior circular road. To this reduction, a monetary value of 15 million £ per year was attributed. |
 | Economic value It had a neutral impact in London economy. |
| Awareness and acceptability No data. |
Case Study 3: EcoPass, Milan (Italy)
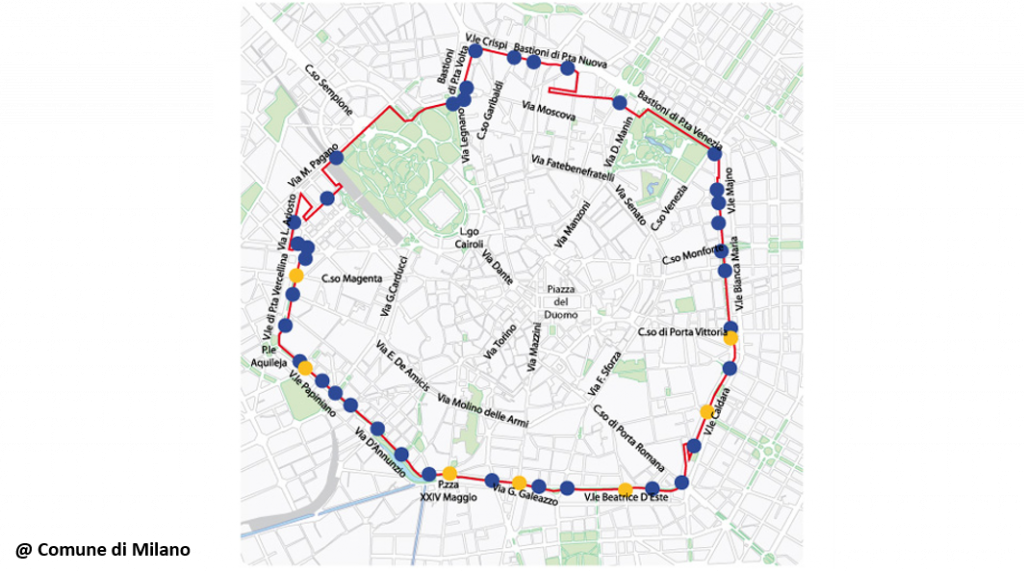
Milan is the greatest industrial city in Italy and has the third greatest concentration of PM10 between the large European cities.
In an attempt to reduce pollution, Milan introduced the EcoPass to all polluting vehicles that enter the central area. EcoPass was implemented in 2008 has a way to improve mobility and safeguard public health and the environment. It aims to:
- Improve air quality by reducing PM emissions in the city centre by 30%, simultaneously improving the environment in surrounding areas;
- Alleviate congestion by reducing the number of incoming cars by 10%;
- Push public transportation, reinvesting all of the income generated by EcoPass in sustainable mobility and the protection of the environment.
Impact:
| Mobility system efficiency There was an increase in average speed of 4% during rush hour, which suggests a reduction in congestion and improvement in the efficiency of the mobility system. Simultaneously, public transportation speed increased by 6%, leading to improved reliability. |
| Livable streets No evidence was presented, but preliminary studies showed that up to 38% of those inquired were in favour for the expansion of Zone a Traffico Limitato (ZTL), Rome’s road charging programme. Additionally, 31% of those inquired would have liked the fee to be extended to motorcycles and mopeds and 7% would have liked to see an increase in the fee value. |
| Protection of the environment In the first year there was a 14% reduction in PM10, 11% in nitrogen dioxides and 9% in carbon dioxide. |
| Inclusion, equity and accessibility No data. |
| Safety and comfort In the first year there was a 14.4% reduction in accidents inside the EcoPass area, while outside the area there was 4,6% reduction. |
| Economic value No data. |
| Awareness and acceptability No data. |
Legend:
| Very positive | Positive | Neutral | Negative | Very negative |
KonSULT. Knowledgebase on Sustainable Urban Land use and Transport. (2014). Road User Charging. Accessed 17 January 2019. Available at: www.konsult.leeds.ac.uk/pg/01/
EPOMM (2015). Tarifação do congestionamento. Accessed 17 January 2019. Available at: http://www.epomm.eu/newsletter/v2/eupdate.php?nl=0415&lan=pt
VTPI. Victoria Transport Policy Institute (2018). Road Pricing. Online Transportation Demand Management (TDM) Encyclopedia. Accessed 3 July 2019. Available at: https://www.vtpi.org/tdm/tdm35.htm